Editor’s note: Here is a top 10 of the best data visualisations according to the blog Awesome Infographics, and they are pretty good indeed! Now we want to hear about you: what is your top data visualisation? Have you come across a stunning infographic lately? Tell us in the comment section..
ONE
Visualising Alcohol Use: What Percentage of the U.S. Drinks Regularly?
Brought to you by Phlebotomist.net
TWO
The World’s Resources by Country

Credit: British Geological Survey
THREE
A HAND DRAWN infographic. Non of that inDesign bullshit for this guy.

FOUR
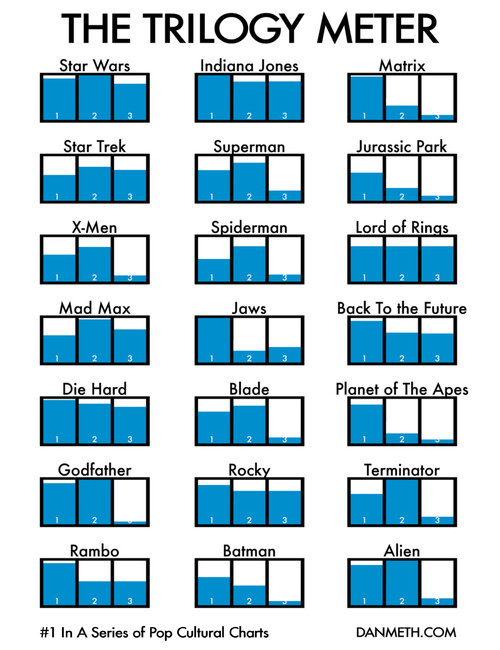
The Trilogy Meter

FIVE
The Jedi Trainer’s Guide to Employee Management

Thanks to www.MindFlash.com for this one. [Read more…]


Graphics really make a difference! Now to find a graphic artist =D