 The Guardian’s Data Store have compiled a catalogue of all the data to do with London, to give readers an objective and overall view of what is happening in the capital.
Polly Curtis’ reality check on 12 April, pins Boris Johnson and Ken Livingstone against each other and asks, “Who is right on police numbers?” She then outlines the Met police figures for London, highlighting what each party have claimed. Polly’s verdict:
Johnson’s campaign is correct in claiming that police officer numbers have risen over his term, albeit only by 2.4% if you take the baseline to be the March 2008, closest to when he was elected in May. But Labour is right that since 2009, the last year that Livingstone budgeted for, numbers have fallen overall by 1.17%.
An interactive map of the number of cycle and pedestrian road casualties offers in insight into road traffic accident hotspots across London. The map produced by ITO World for campaigning group See Me, Save Me, gathers together a decade of road casualty data from the Department for Transport called Stats19. The map distinguishes between pedestrians and cyclists and divides them up between those who were hit by Heavy Goods Vehicles (HGV) and those that weren’t. It also shows the age of the pedestrian or cyclist and the year of the accident. The stand first of the map asks, “With transport a key issue in the mayoral election, what patterns does this map show?”
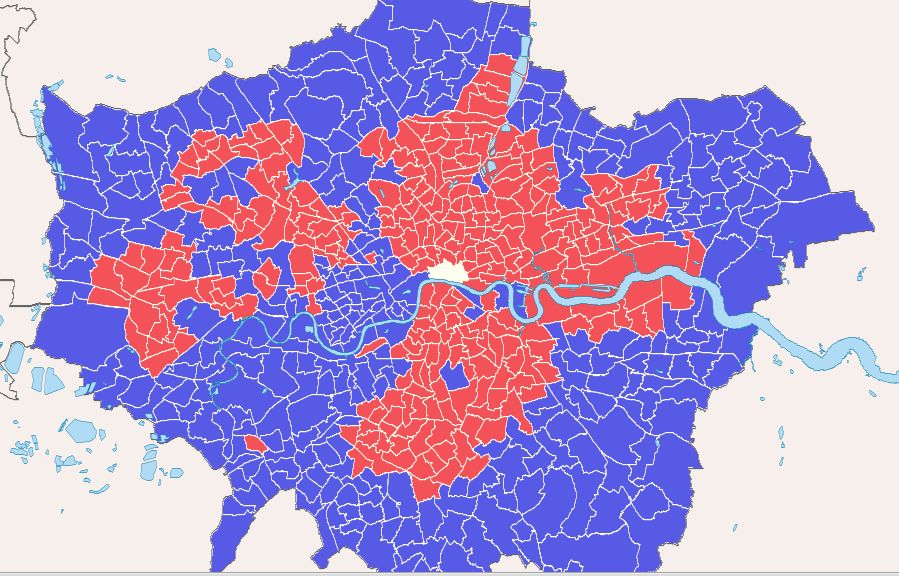
In addition to showing a map of poverty and deprivation in London, data behind health, education and crime, the Data Store have also created a map showing how London voted in the last Mayoral elections, to give an overview of the Conservative and Labour areas across the capital.
Looking into data and presenting them as maps and infographics can show the bigger context behind a story and make figures more accessible. The Guardian Data stores compilation of London Data allows readers to get an objective view of their city before making decisions on who to vote for this coming Thursday 3 May. Take a look at the data for yourself at http://www.guardian.co.uk/uk/series/london-the-data before voting begins in a couple of days!
