The Science of Social Timing [infographic]

Mind Jumpers – By Charu Dwivedi

We all post content on Facebook. Sometimes it’s well read, sometimes not, in spite of putting in our best effort and intentions. Well, apart from what we post, it is important to know when we post. In this blog post, I will attempt to highlight the different social media timing preferences and how they impact different businesses by looking at Buddy Media’s report on effective wall posts published earlier this year together with a recent infographic by Dan Zarrella atHubSpot.

To understand the impact of accurate social media timing, we earlier referred to the Buddy Media report that gave sector wise break-ups of the interest level for every post and time at which it is supposed to peak and tank.

Most effective time to post
According to the Buddy Media report, brands that post outside business hours have 20% higher engagement rates. As a result, for instance content aimed for US, Asian and European consumers will benefit from being timed differently. In the same way, every industry is said to have different traction on different days. The same report also quotes that posts show a higher engagement on a few days compared to others. For example, sports industry and automotive industry have the highest traction on Sundays whereas entertainment peaks on Thursdays and Fridays (18% higher rates). Business and finance hit high on mid week.

General observations:
– Shares on Facebook spike around 7PM, while Twitter spikes around noon.

– On Facebook, content shared on a Saturday is more effective, while Twitter gets the highest engagement mid week. Also, it is good to share 1 post in every 2 days on Facebook.

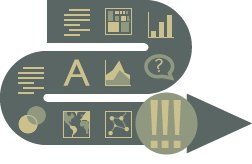
However, here is an interesting infographic on timing in social networks, which I found on Socialmediagraphics.com. It highlights consumer behaviour on different social media channels, namely Twitter and Facebook. The infographic, The Science of Social Timing, gives us insight into posting at which time to make the content most sharable.

Take a look at the infographic here:

science-of-social-timing-part-1

BEST OF Chaos Communication Camp 2011 INTERVIEWS

OWNI.Eu

OWNI erected its tent at the Chaos Communication Camp this year for five days. Where? In an ancient Soviet military base, complete with airplanes and an open air museum. 3,500 hackers were expected for what is known to be the largest assembly of the kind in Europe. Here’s a collection of the best of OWNI’s interviews from these five days in the heart of hackerdom.

Birgitta Jónsdóttir: “Keep the freedom of information what it should be: free.”

The Icelandic deputy Birgitta Jónsdóttir is the backbone behind the Icelandic Media Modernization Initiative (IMMI), a resolution that aims to make Iceland into a paradise for freedom of expression.

[vimeo 27685673]


Macro: “I hope that being part of a hackerspace will no longer be so underground.”

Created in 1995 in Berlin, the C-Base was one of the first hackerspaces in the world, even if it has begun to think of itself as more of a makerspace. 350 members strong, it hosts CCC events and artistic performances. We look under the tent with Marco, their current “chief.”

[vimeo 27685289]

[Read more…] 

TELLING STORIES WITH DATA: THE NEXT CHAPTER


Telling Stories With Data – By Adam, Jessica, Joan, Karrie, and Nicholas

Sunday, October 23, 2011 in Providence, Rhode Island(at VisWeek 2011)

While visualization is an excellent tool for discovery and analysis, it is also a powerful medium for communication. The best information graphics do more than just present numbers: they tell a story, engage and convince their readers, invite them to make a personal connection to the data, and help them tell stories of their own.

This VisWeek 2011 workshop will examine the construction of narratives with visualization. We plan to draw participants with interests in visualization, social media, journalism, and storytellers.

Last year, at VisWeek 2010, the first workshop on ‘Telling Stories with Data’ took place in Salt Lake City.  This workshop brought together dozens of visualization researchers, journalists, humanities scholars, and tool builders to talk about how data has the potential to promote increasingly sophisticated and data-literate conversations to the world at large. [Read more…]

Visualize This: How to Tell Stories with Data

BRAIN PICKINGS – By Maria Popova

How to turn numbers into stories, or what pattern-recognition has to do with the evolution of journalism.


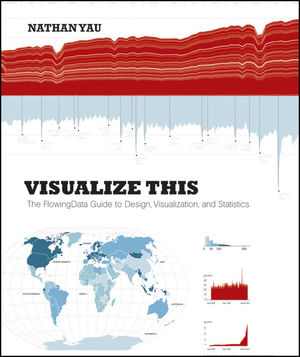
Data visualization is a frequent fixation around here and, just recently, we looked at 7 essential books that explore the discipline’s capacity for creative storytelling. Today, a highly anticipated new book joins their ranks —Visualize This: The FlowingData Guide to Design, Visualization, and Statistics, penned by Nathan Yau of the fantastic FlowingDatablog. (Which also makes this a fine addition to our running list of blog-turned-book success stories.) Yu offers a practical guide to creating data graphics that mean something, that captivate and illuminate and tell stories of what matters — a pinnacle of the discipline’s sensemaking potential in a world of ever-increasing information overload.

And in a culture of equally increasing infographics overload, where we are constantly bombarded with mediocre graphics that lack context and provide little actionable insight, Yau makes a special point of separating the signal from the noise and equipping you with the tools to not only create better data graphics but also be a more educated consumer and critic of the discipline.

[youtube Q9RWwKntuXg]

From asking the right questions to exploring data through the visual metaphors that make the most sense to seeing data in new ways and gleaning from it the stories that beg to be told, the book offers a brilliant blueprint to practical eloquence in this emerging visual language. [Read more…]


Contextual Analytics & The Physicality of Data -> #journalism #content #communities #transmedia #innovation

A Literacy of the Imagination – By Gunther Sonnenfeld

[vimeo 26449216]

Here’s a video excerpt of another talk I gave recently at Miami Ad School on immersive media, and more specifically, data methodologies for understanding or contextualizing consumer behavior and the various ways we can engage communities of people who are connected through content.

A couple of notes:

– Since the time of this talk (May), we’ve already added new social metrics onHeardable, and are about to release several new modules, including a semantic engine that measures digital influence (not just social media influence), as well as an SEO analyzer that allows users to track and optimize popular keywords. We are also developing a system that gives users the ability to quickly generate reports comprised of rich, competitive insights. [Read more…]

A Data Visualization of U.S. Newspaper History

10,000 WORDS – By Meranda Watling

A few weeks ago, I shared a link to the coolest way to visually see what’s news around the world. Now, here comes an interesting way to see what was news. Well, rather, who was covering the news and when in the U.S. It’s a data visualization of newspapers past. And it’s pretty cool, if somewhat depressing.

The Rural West Initiative at Standford University created the map by plotting the U.S. Library of Congress catalog of newspapers (140,000 publications??) over time and space. These are the results (click to see the real maps).

Through the sidebar content as you scroll through the timeline, you get a feel for the different “eras” of newspapering, from the colonies to the frontier to yellow journalism and merger mania. [Read more…]

6 ways of communicating data journalism (The inverted pyramid of data journalism part 2)

OJB – By Paul Bradshaw

Last week I published an inverted pyramid of data journalism which attempted to map processes from initial compilation of data through cleaning, contextualising, and combining that. The final stage – communication – needed a post of its own, so here it is.

UPDATE: Now in Spanish too.

Below is a diagram illustrating 6 different types of communication in data journalism. (I may have overlooked others, so please let me know if that’s the case.)

Communicate: visualised, narrate, socialise, humanise, personalise, utilise

Modern data journalism has grown up alongside an enormous growth in visualisation, and this can sometimes lead us to overlook different ways of telling stories involving big numbers. The intention of the following is to act as a primer for ensuring all options are considered.

1. Visualisation

Visualisation is the quickest way to communicate the results of data journalism: free tools such as Google Docs allow it with a single click; more powerful tools like Many Eyes only require the user to paste their raw data and select from a range of visualisation options. [Read more…]

Data journalism at the Guardian: what is it and how do we do it?

Data journalism. What is it and how is it changing? Photograph: Alamy

The Guardian’s Data Blog – By 

Simon Rogers: Our 10 point guide to data journalism and how it’s changing

Here’s an interesting thing: data journalism is becoming part of the establishment. Not in an Oxbridge elite kind of way (although here’s some data on that) but in the way it is becoming the industry standard.

Two years ago, when we launched the Datablog, all this was new. People still asked if getting stories from data was really journalism and not everyone had seen Adrian Holovaty’s riposte. But once you’ve hadMPs expenses and Wikileaks, the startling thing is that no-one asks those questions anymore. Instead, they want to know, “how do we do it?”

Meanwhile every day brings newer and more innovative journalists into the field, and with them new skills and techniques. So, not only is data journalism changing in itself, it’s changing journalism too.

These are some of the threads from my recent talks I thought it would be good to put in one place – especially now we’ve got an honourable mention in the Knight Batten award for journalistic innovation. This is about how we do it at the Guardian. In 10 brief points.

1. It may be trendy but it’s not new

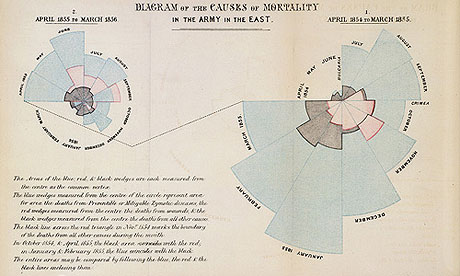
Nightingale graphic
Florence Nightingale's 'coxcomb' diagram on mortality in the army


Data journalism has been around as long as there’s been data – certainly at least since Florence Nightingale’s famous graphics and report into the conditions faced by British soldiers of 1858. The first ever edition of the Guardian‘s news coverage was dominated by a large (leaked) table listing every school in Manchester, its costs and pupil numbers. [Read more…]


KF Alumn to lead Knight Mozilla Effort

Photo by Daniel X. O'Neill

KNIGHT GARAGE – By PAM MAPLES

Dan Sinker, a 2008 Knight Fellow, is joining Mozilla to lead the Knight-Mozilla News Technology Partnership.

The program is funded by the Knight Foundation and run by Mozilla, makers of the Firefox web browser. The goal is to help create deeper collaboration between journalists and technologists through a series of design challenges like this one in San Francisco last spring,  learning labs and a fellowship program that puts developers in residence at newsrooms around the world. This year, the partner newsrooms for fellows are Al Jazeera, the BBC, the Guardian, Die Zeit and the Boston Globe. [Read more…]