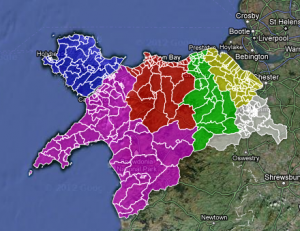
This is the data analysis behind how I, Andrew Stuart, did the data for the Daily Post interactive election map for 2012 on the website for the Daily Post, a regional daily newspaper in North Wales. I used Google Docs and Excel to work with the data we got hold of.

As a British citizen, I know that getting information for council elections is pretty difficult. How do you vote? Yes, you can vote along party lines, but they are generally dictated by national policy, wherever that may be. Generally, for local council elections, you have to wait for the information to drop through the letter box, or have a story about them.
However, Local councils really are where the stuff that we see and use on a day-to-day basis is done. Rubbish collections, inspecting where we go to eat, repairing the roads, street lighting, and planning. So, the people who decide this policy are important. And, knowing what they’re for, against, or couldn’t give two hoots about matters.
Sadly, writing individual feature pieces on 243 wards, with over 753 residents putting their names forward, for a regional paper covering 6 counties (5 of which are to have elections) is next to impossible. I say next to, because nothing is impossible.
So, when I was at the Daily Post, we decided to use the web to show who was standing where. That way, they are a quick Google search or a reference away to find out more about them. This is what we came up with:

So, how did we do it?
First, you need to gather data. This sounds easier than it is. Some council’s had a nice list of each statement of nomination so you can scroll through. Some had a good word doc for reference. Some had the images saved as PDF files, and are on the website individually. Some had three different areas of the council because the county is so big! All of them were not in the same format.
So, we have to type them out. Not the best way, but the only way. These are new candidates, and the data is not online in any sort of format I can import to Google Docs. Claire Miller for WalesOnline had to do the same thing. For every council in Wales, bar the 5 I did. I do not envy her job.
I typed all the name for a ward into the one cell in the format “Name Middle name surname (party), etc”. The comma is important. I saved three files – the online version, the reference version, and a raw backup.
Using a uniform way of typing means I can parse easily at the comma. This allows the file to be shared around different journalists, so they can cover the patches and get the story behind the story. The single cell one for online works in the info box.
The next bit was to make the map work. For this, I need the KML files. There is an easy way of doing this using ScraperWiki. That would bring all the children of each County Council into a file. What I did, however, was to save each file from mapit.mysociety.org (not that strenuous), then create individual county shapefiles in Google Earth. I then have individual maps, and joining all the wards together allows me to create a whole North Wales map.
Then, merge the two tables – the one with all the prospective councillor details and the one with the shape files into Google Fusion tables, and check for errors. The one which did flag up was Mostyn. There is a Mostyn ward in Conwy and Flintshire. The way around it? Type Mostyn, Conwy, and Mostyn Flintshire. It worked.
All you need to do then is to colour the shapefiles by county. To do this, I put the HTML colour codes in a column on the councillor list, and selected that column as the one for the colours for the polygons, and you have coloured counties.
And to get around the way of Anglesey not having elections? In the Anglesey cells, I typed no election. The info box then shows no election.
That’s how you inform 243 wards of who’s standing where, in one fell swoop, and may I say so, quite beautifully too.
This was originally posted on andrewwgstuart.com. Trinity Mirror own copyright for the cuttings used in this piece. Andrew Stuart created the map.
