The Data Journalism Handbook at #MozFest 2011 in London

The following post is from Jonathan Gray, Community Coordinator at the Open Knowledge Foundation.

With the Mozilla Festival approaching fast, we’re getting really excited about getting stuck into drafting the Data Journalism Handbook, in a series of sessions run by the Open Knowledge Foundation and the European Journalism Centre.

As we blogged about last month, a group of leading data journalists, developers and others are meeting to kickstart work on the handbook, which will aim to get aspiring data journalists started with everything from finding and requesting data they need, using off the shelf tools for data analysis and visualisation, how to hunt for stories in big databases, how to use data to augment stories, and plenty more.

We’ve got a stellar line up of contributors confirmed, including:

Here’s a sneak preview of our draft table of contents:

  • Introduction
    • What is data journalism?
    • Why is it important?
    • How is it done?
    • Examples, case studies and interviews
      • Data powered stories
      • Data served with stories
      • Data driven applications
    • Making the case for data journalism
      • Measuring impact
      • Sustainability and business models
    • The purpose of this book
    • Add to this book
    • Share this book
  • Getting data
    • Where does data live?
      • Open data portals
      • Social data services
      • Research data
    • Asking for data
      • Freedom of Information laws
      • Helpful public servants
      • Open data initiatives
    • Getting your own data
      • Scraping data
      • Crowdsourcing data
      • Forms, spreadsheets and maps
  • Understanding data
    • Data literacy
    • Working with data
    • Tools for analysing data
    • Putting data into context
    • Annotating data
  • Delivering data
    • Knowing the law
    • Publishing data
    • Visualising data
    • Data driven applications
    • From datasets to stories
  • Appendix
    • Further resources

If you’re interested in contributing you can either:

  1. Come and find us at the Mozilla Festival in London this weekend!
  2. Contribute material virtually! You can pitch in your ideas via the public data-driven-journalismmailing list, via the #ddj hashtag on Twitter, or by sending an email to bounegru@ejc.net.

We hope to see you there!

Scraping data from a list of webpages using Google Docs

OJB – By Paul Bradshaw

Quite often when you’re looking for data as part of a story, that data will not be on a single page, but on a series of pages. To manually copy the data from each one – or even scrape the data individually – would take time. Here I explain a way to use Google Docs to grab the data for you.

Some basic principles

Although Google Docs is a pretty clumsy tool to use to scrape webpages, the method used is much the same as if you were writing a scraper in a programming language like Python or Ruby. For that reason, I think this is a good quick way to introduce the basics of certain types of scrapers.

Here’s how it works:

Firstly, you need a list of links to the pages containing data.

Quite often that list might be on a webpage which links to them all, but if not you should look at whether the links have any common structure, for example “http://www.country.com/data/australia” or “http://www.country.com/data/country2″. If it does, then you can generate a list by filling in the part of the URL that changes each time (in this case, the country name or number), assuming you have a list to fill it from (i.e. a list of countries, codes or simple addition).

Second, you need the destination pages to have some consistent structure to them. In other words, they should look the same (although looking the same doesn’t mean they have the same structure – more on this below).

The scraper then cycles through each link in your list, grabs particular bits of data from each linked page (because it is always in the same place), and saves them all in one place.

Scraping with Google Docs using =importXML – a case study

If you’ve not used =importXML before it’s worth catching up on my previous 2 posts How to scrape webpages and ask questions with Google Docs and =importXML and Asking questions of a webpage – and finding out when those answers change.

This takes things a little bit further. [Read more…]

An Analysis of Steve Jobs Tribute Messages Displayed by Apple


Editor’s Note: We found this great example of data mining and thought it would be a shame not to share it with you. Neil Kodner analysed the data from all the tribute messages that were sent to Apple  after Steve Jobs passed away and checked for patterns and trends in what people were saying. Here is how he did it…

Neil Kodner.com 

Two weeks have passed since Apple’s Co-Founder/CEO Steve Jobs passed away.  Upon his passing, Apple encouraged people to share their memories, thoughts, and feelings by emailing rememberingsteve@apple.com. Earlier this week, Apple posted asite (http://www.apple.com/stevejobs) in tribute to Steve Jobs. According to the site, over a million people have submitted messages. The site cycles through the submitted messages.

I decided to take a closer look at what people are saying about Steve Jobs, as a whole. Looking at how the site updates, it appears to use Ajax to retrieve and display new messages. Using Chrome’s developer tools, I monitored the requests it was making to get the new messages.


Once I found the location of the individual messages, it was trivial to download all of them. The message endpoint URLs are in the format

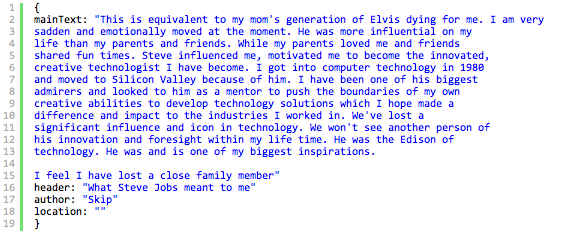
and a sample message looks like


The site makes a request to http://www.apple.com/stevejobs/messages/main.json which returns


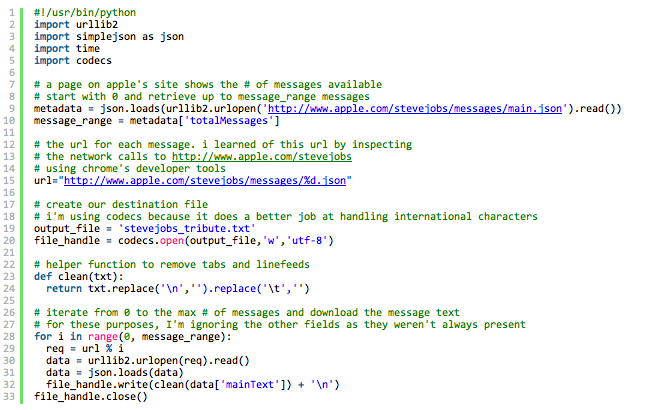
So it appears that it cycles through 10975 messages. I didn’t decompose the javascript powering the site to determine this, I just made an assumption. I tried querying values greater than 10975 and they returned 404. I wrote a quick python program to download the messages:

So now, we have over ten thousand tribute messages saved to the file stevejobs_tribute.txt. What I was most interested in seeing how many of these messages contain a reference to a certain Apple product.
I came up with a few search terms based on some legendary Apple product names including

  • Newton
  • Macintosh
  • MacBook
  • iBook
  • Mac
  • iPhone
  • iPod
  • iMac
  • iPad
  • Apple II family
  • OSX
  • iMovie
  • Apple TV
  • iTunes
  • LaserWriter (yes, Laserwriter)
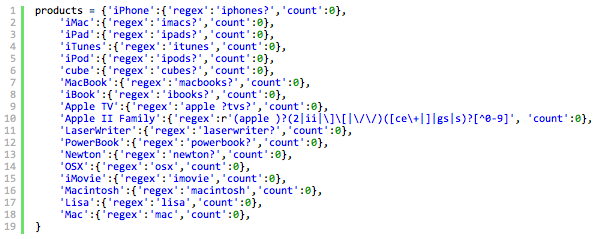
Each product received an entry in a python dictionary. The value is another dictionary containing a regex for the product name and a count for the running totals. Some of the regular expressions are as simple as testing for an optional s at the end of the product name, some are a little more complex – check the Apple II regular expression to match all of entire product Apple 2 line. As I’m ok but not great with regular expressions, I welcome your corrections.

Here’s a screenshot of me testing the Apple II regular expression, using the excellent Regexr.

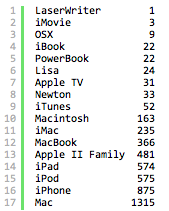
Overall, out of 10975 messages downloaded(as of now), 2,186, or just under 20% mentioned an apple product by name. Here’s the breakdown of the products mentioned:

More than one out of every ten messages included a reference to a Mac! Nearly one in ten mentioned an iPhone – not bad for a device that’s been out a fraction of the time the Mac has been available. [Read more…]

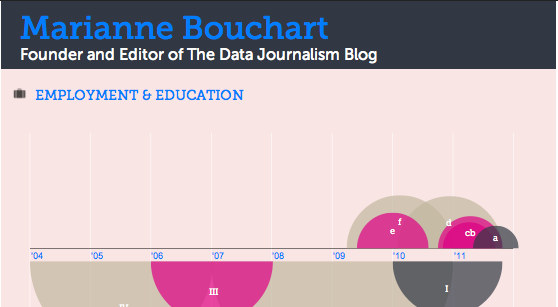
4 Simple Tools for Creating an Infographic Resume

Editor’s note: As data journalists, designers or other data enthusiasts, what a better way to show off your skills than with an infographic resume? Here is a very useful article by Mashable’s  introducing four very interesting tools to make your profile stand out! Show us your infographic resume in our Data Art Corner. The best examples will be featured in the DJB’s front page next month!

MASHABLE – By 

As a freelancer or job seeker, it is important to have a resume that stands out among the rest — one of the more visually pleasing options on the market today is the infographic resume.

An infographic resume enables a job seeker to better visualize his or her career history, education and skills.

Unfortunately, not everyone is a graphic designer, and whipping up a professional-looking infographic resume can be a difficult task for the technically unskilled job seeker. For those of us not talented in design, it can also be costly to hire an experienced designer to toil over a career-centric infographic.

Luckily, a number of companies are picking up on this growing trend and building apps to enable the average job seeker to create a beautiful resume.

To spruce up your resume, check out these four tools for creating an infographic CV. If you’ve seen other tools on the market, let us know about them in the comments below.


1. Vizualize.me


Vizualize.me is a new app that turns a user’s LinkedIn profile information into a beautiful, web-based infographic.

After creating an account and connecting via LinkedIn, a user can edit his or her profile summary, work experience, education, links, skills, interests, languages, stats, recommendations and awards. And voila, astunning infographic is created.

The company’s vision is to “be the future of resumes.” Lofty goal, but completely viable, given that its iteration of the resume is much more compelling than the simple, black-and-white paper version that currently rules the world.


2. Re.vu


Re.vu, a newer name on the market, is another app that enables a user to pull in and edit his or her LinkedIn data to produce a stylish web-based infographic.

The infographic layout focuses on the user’s name, title, biography, social links and career timeline — it also enables a user to add more graphics, including stats, skill evolution, proficiencies, quotes and interests over time.

Besides the career timeline that is fully generated via the LinkedIn connection, the other graphics can be a bit tedious to create, as all of the details must be entered manually.

In the end, though, a very attractive infographic resume emerges. This is, by far, the most visually pleasing option of all of the apps we reviewed.


3. Kinzaa


Based on a user’s imported LinkedIn data, Kinzaa creates a data-driven infographic resume that focuses on a user’s skills and job responsibilities throughout his or her work history.

The tool is still in beta, so it can be a bit wonky at times — but if you’re looking for a tool that helps outline exactly how you’ve divided your time in previous positions, this may be your tool of choice.

Unlike other tools, it also features a section outlining the user’s personality and work environment preferences. Details such as preferences on company size, job security, challenge level, culture, decision-making speed and more are outlined in the personality section, while the work environment section focuses on the user’s work-day length, team size, noise level, dress code and travel preferences.


4. Brazen Careerist Facebook App


Brazen Careerist, the career management resource for young professionals, launched a new Facebook application in September that generates an infographic resume from a user’s FacebookTwitter and LinkedIn information.

After a user authorizes the app to access his or her Facebook and LinkedIn data, the app creates an infographic resume with a unique URL — for example, my infographic resume is located atbrazen.me/u/ericaswallow.

The infographic features a user’s honors, years of experience, recommendations, network reach, degree information, specialty keywords, career timeline, social links and LinkedIn profile image.

The app also creates a “Career Portfolio” section which features badges awarded based on a user’s Facebook, Twitter and LinkedIn achievements. Upon signing up for the app, I earned eight badges, including “social media ninja,” “team player” and “CEO in training.” While badges are a nice addition, they aren’t compelling enough to keep me coming back to the app.


Scraperwiki now makes it easier to ask questions of data

OJB – By Paul Bradshaw

I was very excited recently to read on the Scraperwiki mailing list that the website was working on making it possible to create an RSS feed from a SQL query.

Yes, that’s the sort of thing that gets me excited these days.

But before you reach for a blunt object to knock some sense into me, allow me to explain…

Scraperwiki has, until now, done very well at trying to make it easier to get hold of hard-to-reach data. It has done this in two ways: firstly by creating an environment which lowers the technical barrier to creating scrapers (these get hold of the data); and secondly by lowering the social barrier to creating scrapers (by hosting a space where journalists can ask developers for help in writing scrapers).

This move, however, does something different.

It allows you to ask questions – of any dataset on the site. Not only that, but it allows you to receive updates as those answers change. And those updates come in an RSS feed, which opens up all sorts of possibilities around automatically publishing those answers.

The blog post explaining the development already has a couple of examples of this in practice:

Anna, for example, has scraped data on alcohol licence applications. The new feature not only allows her to get a constant update of new applications in her RSS reader – but you could also customise that feed to tell you about licence applications on a particular street, or from a particular applicant, and so on. [Read more…]

Strata Summit 2011: Generating Stories From Data [VIDEO]

As the world of data expands, new challenges arise. The complexity of some datasets can be overwhelming for journalists across the globe who “dig” for a story without the technical skills. Narrative Science’s Kristian Hammond addressed this challenge during last week’s Strata Summit in New York in a presentation about a software platform that helps write stories out of numbers…

[youtube P9hJJCOeIB4]


Training data driven journalism: Mind the gaps

Data Driven Journalism – original post can be found here

Editor’s note

Between April and August 2011 the European Journalism Centre (EJC) circulated a survey on training needs for data journalism. We asked two members of our Editorial Board, experts in data journalism, journalist and trainer Mirko Lorenz, and journalism professor and trainer Paul Bradshaw, to analyse the results and share their insights with us. This article is an analysis of the survey results by Mirko Lorenz. On Thursday we will publish the analysis of the survey results by Paul Bradshaw. This second article in the series will be accompanied by the survey data.

Competency with numbers and statistics is a promising field. The assumption is that this competency would enable journalism to gain a greater level of depth and accuracy. But what are the training needs? How can we make this happen? The results of a survey ran by the European Journalism Centre provide some insights into this. Judging from the results of this survey, here is a run-down of the opportunities and challenges that lie ahead.

Data driven journalism on the rise

For the last two years there has been a growing interest in data driven journalism. The Guardian, The New York Times, The Texas Tribune, and The Los Angeles Times are now presenting new ways to look at data from different angles. This adds more clarity and often creates surprises. As a result these offerings are becoming increasingly popular, especially when there is chance to access raw data.

There are many unsolved questions however, regarding data analysis. How can journalists make better use of the numbers, avoid the frequent misinterpretation of statistics, check the reliability of the collected data, and present the facts in a simple yet accurate way in order to overcome pressing problems?

Results from the EJC survey on training needs for data journalism

In an attempt to discover better and more effective ways of training, the European Journalism Centre conducted a survey that ran from April to August. Roughly 200 journalists participated and about 134 of the total number of surveys were fully completed. After much anticipation, the results are finally in.

Subjects who took the survey were in some way familiar with the field of data journalism. Thus we can make no claims for representativeness. Nor are these insights sufficient for designing a training session that fully covers all aspects of data journalism. The answers to the 26 questions of the survey, however, will help you get a better grip on the sentiment, expectations and concerns that are out there.

Selected findings

Here is a brief list of the findings, based on the answers to the survey questions:

1. Opportunity

There is a growing group of journalists who are highly interested in further investigation of datasets. This opportunity of using new sources and new tools is like shining a light into the black boxes that surround us. Or, as a respondent put it: ‘Data can offer insights that contradict popular presumptions’.

graph_1.png

2. Motivation

The argument as to what should be learned in order to be a good data journalist varies wildly. Some say that the future journalist should be a researcher, programmer, and designer, thus packing three university degrees into one. Judging from conversations and comments this is a scary perspective for many journalists. Gradually though, this ‘super-expert’ model is being brought down. One reason is because the use of the tools is getting easier. The barrier to coding is lowering and the techniques to write a few lines of code are becoming less complex. Another development is that by learning from good examples of data journalism one can tell that diligence, persistence and creative thinking are probably as important as formal knowledge.

3. Use of data

What are the expectations? The journalists who participated see several ways of how data can be used. Firstly, they want to use data more to provide context, background and perspective. Secondly, they want to dig into the reliability of public claims – are they true, yes or no? What comes out as positive is that data journalism is more than just adding colourful pictures to a story. It allows for new perspectives to be uncovered thus giving more depth and shape to the overall picture.

graph_2.png

4. Training needs

Where do journalists need support? What is interesting about the answers is that journalists effectively call for a systematic approach illustrating that how to analyse and how to visualise data are in high demand. Other actions, such as how to search and how to check reliability are viewed as important as well. Learning how to programme is notably low ranked…

graph_3.png

5. Practical use

Seeing the potential of what datasets could do for newsrooms, it is clear that there is a demand for personal skills. Journalists want to be able to work with data themselves. While there should be experts available, they should assist existing staff and not keep their knowledge to themselves.

graph_4.png

6. Barriers

Working on deadlines does not leave that much room to sit down and tinker with data for hours and days. But while lack of time was cited as one barrier to adopting data journalism, the more important barrier was clearly lack of knowledge. In combination with lack of resources and management support one can see why data journalism could benefit from systematic training.

graph_5.1.png
Conclusion: Mind the gaps

Combining the sentiment from the survey with my own experience in preparing training modules for data driven journalism, the current challenge can be boiled down to three words: Mind the gaps.

1. Systematic approach needed: Misinterpretation of numbers and statistics is pretty common and journalists are quite often part of the problem. Wrongly extrapolating trends, misinterpretation of complex developments and lacking information are often encountered mistakes in journalistic discourse.

So, trainers and institutions in this field should be careful not to skip the very basics when working with numbers and statistics. There is a need for diligence and accuracy, not for bigger pictures.

2. Everybody, please move: Journalists have to learn, but publishers have to do their share too. Working with data can bring in new opportunities for publications, whether in pure print or multiple channels. Data, numbers, facts and context can create a solid base, if used correctly. Today the use of numbers often leads to sensationalism. Journalists sometimes add confusion when they do not take the time to investigate the data. While this may not be correct, it makes sense as long as the media remains mainly in the attention-getting business. But getting attention is no longer an exclusive product of media. There are many different channels that people can use to get their information. I would argue that today the scarce resource is trust. Data journalism used wrongly will only amplify attention for a short time and might have a reverse effect should it become clear that the analysis was faulty.

3. Do not mix three professions into one: It is true that the pioneers of data journalism often possess remarkable skills. They are journalists who know how to write code and produce webpages. Most of them trained themselves, driven by a curiosity to visualise unwieldy data in new ways. As things begin to move forward however, the idea of letting everyone do what they are best at might yield bigger gains. Does this mean journalists will be the facilitators of the process, asking questions and searching for data? Yes. Will these same journalists be tinkering with their publications content management system and producing jaw-dropping visuals just in time? Not likely. As data driven journalism moves on, there should be teams. The idea behind this being that a talented designer would assist the journalists in incorporating data into stories in a quick and improved manner.

These processes are still underway and the picture is incomplete at best. But the prospects are still enticing. What are your thoughts? Let us know.


Resources:

  • Slides from presentation of preliminary results of EJC survey on training needs for data journalism

The work of data journalism: Find, clean, analyze, create … repeat

O’REILLY RADAR – By 

Data journalism has rounded an important corner: The discussion is no longer if it should be done, but rather how journalists can find and extract stories from datasets.

Of course, a dedicated focus on the “how” doesn’t guarantee execution. Stories don’t magically float out of spreadsheets, and data rarely arrives in a pristine form. Data journalism — like all journalism — requires a lot of grunt work.

With that in mind, I got in touch with Simon Rogers, editor of The Guardian’s Datablog and a speaker at next week’s Strata Summit, to discuss the nuts and bolts of data journalism. The Guardian has been at the forefront of data-driven storytelling, so its process warrants attention — and perhaps even full-fledged duplication.

Our interview follows.

What’s involved in creating a data-centric story?


Simon RogersSimon Rogers: It’s really 90% perspiration. There’s a whole process to making the data work and getting to a position where you can get stories out of it. It goes like this:

  • We locate the data or receive it from a variety of sources — from breaking news stories, government data, journalists’ research and so on.
  • We then start looking at what we can do with the data. Do we need to mash it up with another dataset? How can we show changes over time?
  • Spreadsheets often have to be seriously tidied up — all those extraneous columns and weirdly merged cells really don’t help. And that’s assuming it’s not a PDF, the worst format for data known to humankind.
  • Now we’re getting there. Next up we can actually start to perform the calculations that will tell us if there’s a story or not.
  • At the end of that process is the output. Will it be a story or a graphic or a visualisation? What tools will we use?

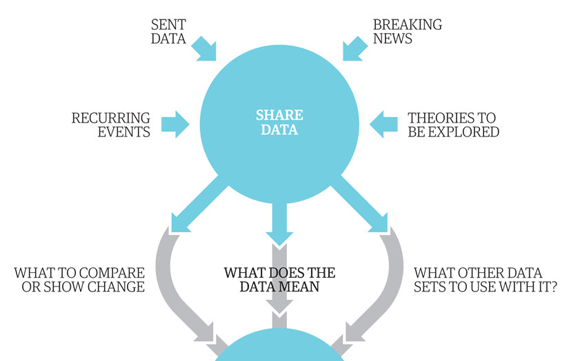
We’ve actually produced a graphic (of how we make graphics) that shows the process we go through:


Guardian data journalism process
Partial screenshot of “Data journalism broken down.” Click to see the full graphic.

What is the most common mistake data journalists make?

Simon Rogers: There’s a tendency to spend months fiddling around [Read more…]


Data-Driven Journalism In A Box: what do you think needs to be in it?

The following post is from Liliana Bounegru (European Journalism Centre), Jonathan Gray (Open Knowledge Foundation), and Michelle Thorne (Mozilla), who are planning a Data-Driven Journalism in a Box session at the Mozilla Festival 2011, which we recently blogged about here. This is cross posted at DataDrivenJournalism.net and on the Mozilla Festival Blog.

We’re currently organising a session on Data-Driven Journalism in a Box at the Mozilla Festival 2011, and we want your input!

In particular:

  • What skills and tools are needed for data-driven journalism?
  • What is missing from existing tools and documentation?

If you’re interested in the idea, please come and say hello on our data-driven-journalism mailing list!

Following is a brief outline of our plans so far…

What is it?

The last decade has seen an explosion of publicly available data sources – from government databases, to data from NGOs and companies, to large collections of newsworthy documents. There is an increasing pressure for journalists to be equipped with tools and skills to be able to bring value from these data sources to the newsroom and to their readers.

But where can you start? How do you know what tools are available, and what those tools are capable of? How can you harness external expertise to help to make sense of complex or esoteric data sources? How can you take data-driven journalism into your own hands and explore this promising, yet often daunting, new field?

A group of journalists, developers, and data geeks want to compile a Data-Driven Journalism In A Box, a user-friendly kit that includes the most essential tools and tips for data. What is needed to find, clean, sort, create, and visualize data — and ultimately produce a story out of data?

There are many tools and resources already out there, but we want to bring them together into one easy-to-use, neatly packaged kit, specifically catered to the needs of journalists and news organisations. We also want to draw attention to missing pieces and encourage sprints to fill in the gaps as well as tighten documentation.

What’s needed in the Box?

  • Introduction
    • What is data?
    • What is data-driven journalism?
    • Different approaches: Journalist coders vs. Teams of hacks & hackers vs. Geeks for hire
    • Investigative journalism vs. online eye candy
  • Understanding/interpreting data:
    • Analysis: resources on statistics, university course material, etc. (OER)
    • Visualization tools & guidelines – Tufte 101, bubbles or graphs?
    • Acquiring data
  • Guide to data sources
  • Methods for collecting your own data
  • FOI / open data
  • Scraping
    • Working with data
  • Guide to tools for non-technical people
  • Cleaning
    • Publishing data
  • Rights clearance
  • How to publish data openly.
  • Feedback loop on correcting, annotating, adding to data
  • How to integrate data story with existing content management systems

What bits are already out there?

What bits are missing?

  • Tools that are shaped to newsroom use
  • Guide to browser plugins
  • Guide to web-based tools

Opportunities with Data-Driven Journalism:

  • Reduce costs and time by building on existing data sources, tools, and expertise.
  • Harness external expertise more effectively
  • Towards more trust and accountability of journalistic outputs by publishing supporting data with stories. Towards a “scientific journalism” approach that appreciates transparent, empirically- backed sources.
  • News outlets can find their own story leads rather than relying on press releases
  • Increased autonomy when journalists can produce their own datasets
  • Local media can better shape and inform media campaigns. Information can be tailored to local audiences (hyperlocal journalism)
  • Increase traffic by making sense of complex stories with visuals.
  • Interactive data visualizations allow users to see the big picture & zoom in to find information relevant to them
  • Improved literacy. Better understanding of statistics, datasets, how data is obtained & presented.
  • Towards employable skills.