Visualize This: How to Tell Stories with Data

BRAIN PICKINGS – By Maria Popova

How to turn numbers into stories, or what pattern-recognition has to do with the evolution of journalism.


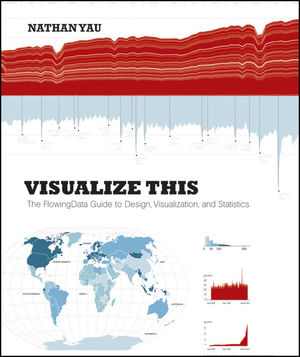
Data visualization is a frequent fixation around here and, just recently, we looked at 7 essential books that explore the discipline’s capacity for creative storytelling. Today, a highly anticipated new book joins their ranks —Visualize This: The FlowingData Guide to Design, Visualization, and Statistics, penned by Nathan Yau of the fantastic FlowingDatablog. (Which also makes this a fine addition to our running list of blog-turned-book success stories.) Yu offers a practical guide to creating data graphics that mean something, that captivate and illuminate and tell stories of what matters — a pinnacle of the discipline’s sensemaking potential in a world of ever-increasing information overload.

And in a culture of equally increasing infographics overload, where we are constantly bombarded with mediocre graphics that lack context and provide little actionable insight, Yau makes a special point of separating the signal from the noise and equipping you with the tools to not only create better data graphics but also be a more educated consumer and critic of the discipline.

[youtube Q9RWwKntuXg]

From asking the right questions to exploring data through the visual metaphors that make the most sense to seeing data in new ways and gleaning from it the stories that beg to be told, the book offers a brilliant blueprint to practical eloquence in this emerging visual language. [Read more…]



6 ways of communicating data journalism (The inverted pyramid of data journalism part 2)

OJB – By Paul Bradshaw

Last week I published an inverted pyramid of data journalism which attempted to map processes from initial compilation of data through cleaning, contextualising, and combining that. The final stage – communication – needed a post of its own, so here it is.

UPDATE: Now in Spanish too.

Below is a diagram illustrating 6 different types of communication in data journalism. (I may have overlooked others, so please let me know if that’s the case.)

Communicate: visualised, narrate, socialise, humanise, personalise, utilise

Modern data journalism has grown up alongside an enormous growth in visualisation, and this can sometimes lead us to overlook different ways of telling stories involving big numbers. The intention of the following is to act as a primer for ensuring all options are considered.

1. Visualisation

Visualisation is the quickest way to communicate the results of data journalism: free tools such as Google Docs allow it with a single click; more powerful tools like Many Eyes only require the user to paste their raw data and select from a range of visualisation options. [Read more…]

Data journalism at the Guardian: what is it and how do we do it?

Data journalism. What is it and how is it changing? Photograph: Alamy

The Guardian’s Data Blog – By 

Simon Rogers: Our 10 point guide to data journalism and how it’s changing

Here’s an interesting thing: data journalism is becoming part of the establishment. Not in an Oxbridge elite kind of way (although here’s some data on that) but in the way it is becoming the industry standard.

Two years ago, when we launched the Datablog, all this was new. People still asked if getting stories from data was really journalism and not everyone had seen Adrian Holovaty’s riposte. But once you’ve hadMPs expenses and Wikileaks, the startling thing is that no-one asks those questions anymore. Instead, they want to know, “how do we do it?”

Meanwhile every day brings newer and more innovative journalists into the field, and with them new skills and techniques. So, not only is data journalism changing in itself, it’s changing journalism too.

These are some of the threads from my recent talks I thought it would be good to put in one place – especially now we’ve got an honourable mention in the Knight Batten award for journalistic innovation. This is about how we do it at the Guardian. In 10 brief points.

1. It may be trendy but it’s not new

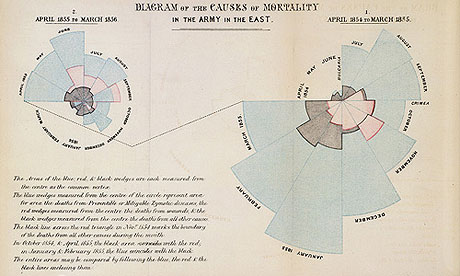
Nightingale graphic
Florence Nightingale's 'coxcomb' diagram on mortality in the army


Data journalism has been around as long as there’s been data – certainly at least since Florence Nightingale’s famous graphics and report into the conditions faced by British soldiers of 1858. The first ever edition of the Guardian‘s news coverage was dominated by a large (leaked) table listing every school in Manchester, its costs and pupil numbers. [Read more…]


Will PANDA save data journalism?

Panda image used under a Creative Commons license from Jenn and Tony Bot

Over the past few years, the Knight Foundation News Challenge has helped develop amazing projects such as DocumentCloud and Localwiki.

Data and the use of it for journalism was a big trend among this year’s winners. No need to say we were quite excited to see this burst of idea dedicated to data journalism.

The project that caught our attention, and not just because of its cute name, is PANDA, a newsroom data application that would help journalists find context and relationships between datasets in a flick of an eye.

“While national news organizations often have the staff and know-how to handle federal data, smaller news organizations are at a disadvantage. City and state data are messier, and newsroom staff often lack the tools to use it,” John Bracken from the Knight Foundation explains. The PANDA project will “help news organisations better use public information.”

Brian Boyer, the news applications editor at the Chicago Tribune, in partnership with Investigative Reporters & Editors (IRE) and The Spokane Spokesman-Review, will build a set of open-source, web-based tools that will make it easier for journalists to use and analyze data. “The goal is to have a system that each news organization can put to their own use,” Boyer said. “I want this to be something an editor can set up for you, not your IT department.”

In the following PPT slides, Brian Boyer explains the concept of PANDA and how it could revolutionize data journalism:


You must have understood by now, there is unfortunately no link to the furry animal, in fact, PANDA stands for PANDA A News Data Application.

One of the backbones of the project will be Google Refine, a tool launched last year that cleans up messy datasets and detect patterns. “One of the added benefits of Google Refine, Boyer said, is that it can help draw relationships across data.” It would also allow newsrooms that can’t afford developers, to integrate PANDA into their workplace easily.

The PANDA project received a $150,000 grant. The money will mainly be used to hire a developer to build the application and to give the project a nice fancy look and easy-to-use features.

The first step in this project will be to survey journalists on how they would like PANDA to work in their newsroom. The team will then have to implement those needs and scale the project across newsrooms of different sizes.

Dealing with big datasets requires big storage space and Boyer said that the best option would be for PANDA to work with a cloud storage system, although they haven’t worked out any specifics yet.

Other data-related projects received Knight funding: ScraperWiki (you can find our interview with their media partner manager here), OpenBlock Rural, Overview and SwiftRiver.

Here is a video from the Knight Foundation website giving an overview of all the projects:

(For Brian Boyer’s talk about the PANDA project, go to 9:42)

[vimeo 25222167]

Visual.ly: The Future of Data-Based Infographics

EAGEREYES – By Robert Kosara

Visual.ly‘s launch today made big waves, but a lot of people seemed to be disappointed by what they saw. The problem is that what you can see on the website is not the really exciting part of Visual.ly. What is much more interesting is how they want to turn the creation of data-based graphics from a tedious manual process into something fast and flexible. That has a lot more potential impact than you might realize at first.

Exploration, Analysis, Presentation

Let’s take a step back and look at the three stages we generally talk about in visualization: exploration, analysis, and presentation. Academic work and tools like Tableau focus on the first two, while there is still very little actual work on the latter. The usual assumption is that the same tools and techniques can be used there as for exploration and analysis, and little attention is typically paid to it.

The result is that presentation is taken over by infographics with varying levels of quality, because people simply get tired of looking at the same bar chart for every piece of data. I think it’s clear that infographics aren’t just popular, they are also more memorable, and when they’re done well, can be very effective.

The key difference between visualization and infographics is that the former is easy to automate and generic, while the latter are specific and usually hand-drawn. Now imagine a better way to create infographics based on data: a way that lets designers work with numbers more easily to create graphics that are visually exciting while still true to the data; a way that encourages and embodies best practices in visualization for designers. That’s Visual.ly. [Read more…]


7 ways to get data out of PDFs

HELP ME INVESTIGATE – By  Paul Bradshaw

A frequent obstacle in data journalism is when the information you want to analyse is locked away in a PDF. Here are 6 ways to tackle that problem – with space for a 7th:

1) For simple PDFs: Google Docs’ conversion facility


Google Docs recently added a feature that allows you to convert a PDF to a ‘Google document’ when you upload it. It’s pretty powerful, and about the simplest way you can extract information.


It does not work, however, if the PDF was generated by scanning – in other words if it is an image, rather than a document that has been converted to PDF.


2) For scanned documents and pulling out key players: Document Cloud


Document Cloud is a tool for journalists to convert PDFs to text. It will also add ‘semantic’ information along the way, such as what organisations, people and ‘entities’ such as dates and locations are mentioned within it, and there are some useful features that allow you to present documents for others to comment on.


The good news is that it works very well with scanned documents, using Optical Character Recognition (OCR). The bad news is that you need to ask permission to use it, so if you don’t work as a professional journalist you may not be able to use it. Still, there’s no harm in asking. [Read more…]


16 Awesome Data Visualization Tools

MASHABLE – by 

From navigating the Web in entirely new ways to seeing where in the world twitters are coming from, data visualization tools are changing the way we view content. We found the following 16 apps both visually stunning and delightfully useful.

Visualize Your Network with Fidg’t
Fidg’t is a desktop application that aims to let you visualize your network and its predisposition for different types of things like music and photos. Currently, the service has integrated with Flickr and last.fm, so for example, Fidg’t might show you if your network is attracted or repelled by Coldplay, or if it has a predisposition to taking photos of their weekend partying. As the service expands to support other networks (they suggest integrations with Facebook, digg, del.icio.us, and several others are in the works), this one could become very interesting.

See Where Flickr Photos are Coming From
Flickrvision combines Google Maps and Flickr to provide a real-time view of where in the world Flickr photos are being uploaded from. You can then enlarge the photo or go directly to the user’s Flickr page.

See Where Twitters are Coming From
From the maker of Flickrvision (David Troy) comes Twittervision, which, you guessed it, shows where in the world the most recent Twitters are coming from. Troy has taken things one step further with Twitter vision and has given each user a page where you can see all of their location updates.

New Ways to Visualize Real-Time Activity on Digg
Digg Labs offers three different ways to visualize activity in real-time on the site, building on the original Digg Spy feature.

BigSpy places stories at the top of the screen as they are dugg. Stories with more diggs show up in a bigger font, and next to each one you can see the number of diggs in red:

[Read more…]

The Royal Wedding: An experiment in data journalism

WANNABE HACKS: by Matthew Caines

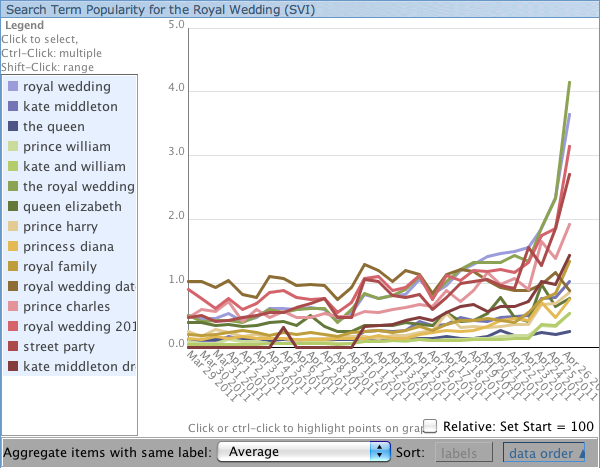
Graph by Matthew Caines using ManyEyes

UPDATE: After having a stab at data journalism today, my first ever piece has since been featured on the MANY EYES homepage. Not too bad for first-timer…

Seeing as today is all about taking the plunge and tying the knot, I’ve been thinking about joining to someone in holy matrimony myself… to data journalism! I say taking the plunge because it’s not necessarily a match made in heaven – data journalism is something I’ve often shied away from, always assuming the tech geeks + web guys are the only ones who can do it and do it well.

My cold feet were that anyone who saw my Microsoft Word multi-coloured pie-chart would surely scoff at my horrendous attempt at interactive data. But I need this marriage to work because data journalism is fast becoming a valuable skill for any aspiring journalist. [Read more…]


10 things every journalist should know about data

NEWS:REWIRED: by SARAH MARSHALL

Picture from News:Rewired website

Every journalist needs to know about data. It is not just the preserve of the investigative journalist but can – and should – be used by reporters writing for local papers, magazines, the consumer and trade press and for online publications.

Think about crime statistics, government spending, bin collections, hospital infections and missing kittens and tell me data journalism is not relevant to your title.

If you think you need to be a hacker as well as a hack then you are wrong. Although data journalism combines journalism, research, statistics and programming, you may dabble but you don’t need to know much maths or code to get started. It can be as simple as copying and pasting data from an Excel spreadsheet. [Read more…]