Open Data And Emergent Digital Horizons At Future Everything 2011 [Event]

PSFK: by Stephen Fortune
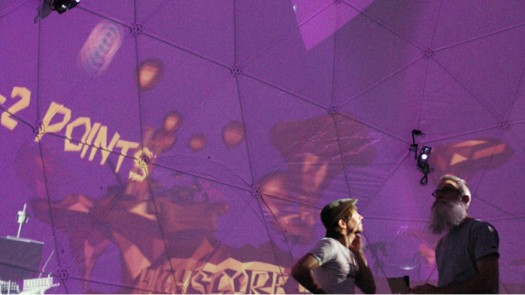
Picture from the PSFK website

Now in it’s 16th year, the recently-renamed FutureEverything Festival will continue to showcase and illuminate creative technologies and digital innovation this coming May in Manchester, UK.

Befitting it’s role in leading Manchester’s recent Open Data revolution, FutureEverything will provide centre stage consideration of Open Data as part of it’s two day conference. Open Data is shifting the digital landscape in a manner comparable to the sea changes which followed in the wake of social media and FutureEverything 2011 offers the means to understand how it will transform the way consumers engage with brands, and the ways citizens engage in local government. The topics under consideration range from the enterprise that can be fomented with open data to what shape algorithm driven journalism will take. [Read more…]


The Royal Wedding: An experiment in data journalism

WANNABE HACKS: by Matthew Caines

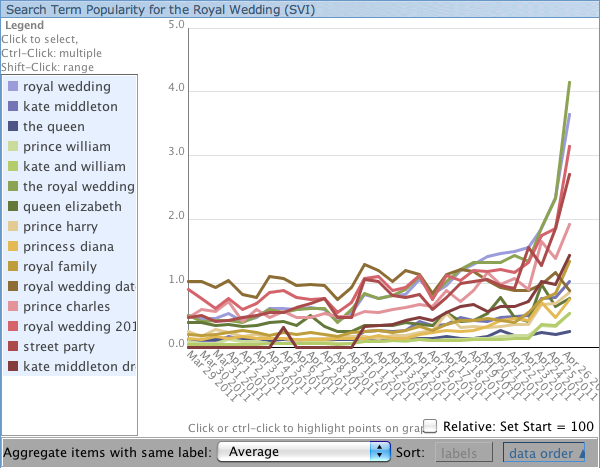
Graph by Matthew Caines using ManyEyes

UPDATE: After having a stab at data journalism today, my first ever piece has since been featured on the MANY EYES homepage. Not too bad for first-timer…

Seeing as today is all about taking the plunge and tying the knot, I’ve been thinking about joining to someone in holy matrimony myself… to data journalism! I say taking the plunge because it’s not necessarily a match made in heaven – data journalism is something I’ve often shied away from, always assuming the tech geeks + web guys are the only ones who can do it and do it well.

My cold feet were that anyone who saw my Microsoft Word multi-coloured pie-chart would surely scoff at my horrendous attempt at interactive data. But I need this marriage to work because data journalism is fast becoming a valuable skill for any aspiring journalist. [Read more…]


The Social Media Buzz Behind the Royal Wedding [INFOGRAPHIC]

MASHABLE: by Ben Parr


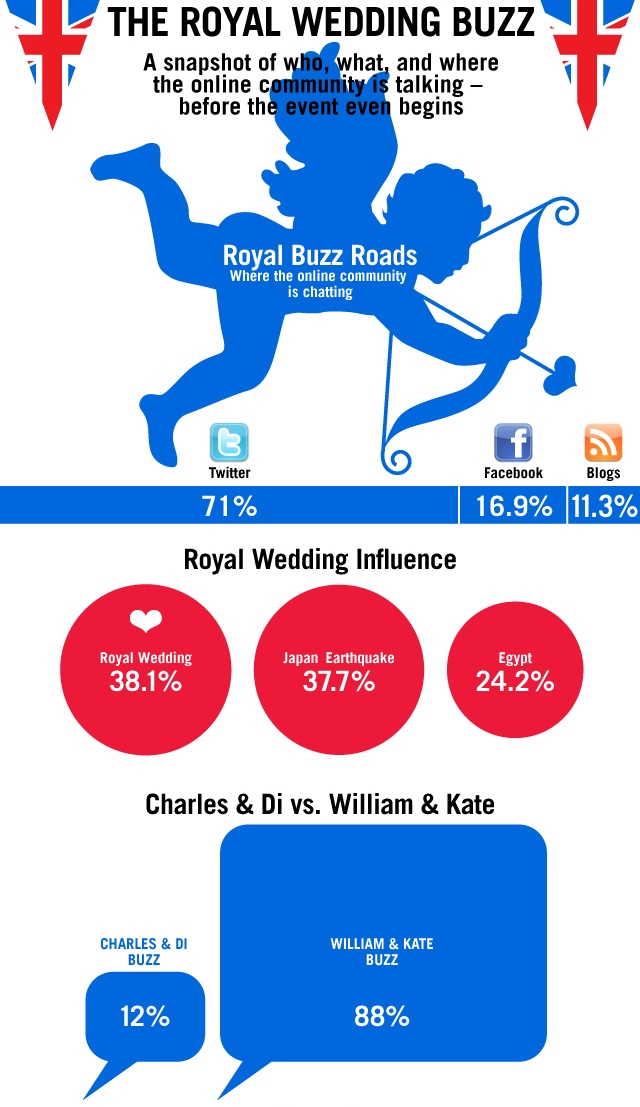
Infographic from Mashable website

With hours to go until the Royal Wedding, online buzz surrounding the big event has surpassed the chatter that surrounded the Egypt uprising and the Japan earthquake.

New stats gathered and analyzed by Webtrends reveal that the world simply can’t stop talking about the Royal Wedding (not that you needed us to tell you). According to the web analytics company, people have sent 911,000 tweets in the last 30 days, or just a little more than 30,000 tweets per day, which accounts for 71% of the buzz Webtrends tracked. For comparison, there were approximately 217,000 Facebook status updates and 145,000 blog posts about William and Kate’s big day. [Read more…]


10 things every journalist should know about data

NEWS:REWIRED: by SARAH MARSHALL

Picture from News:Rewired website

Every journalist needs to know about data. It is not just the preserve of the investigative journalist but can – and should – be used by reporters writing for local papers, magazines, the consumer and trade press and for online publications.

Think about crime statistics, government spending, bin collections, hospital infections and missing kittens and tell me data journalism is not relevant to your title.

If you think you need to be a hacker as well as a hack then you are wrong. Although data journalism combines journalism, research, statistics and programming, you may dabble but you don’t need to know much maths or code to get started. It can be as simple as copying and pasting data from an Excel spreadsheet. [Read more…]


Journalism in the Age of Data: A video report on Data Visualisation a storytelling medium

STANFORD.EU: Geoff McGhee

[vimeo 14777910]

Journalists are coping with the rising information flood by borrowing data visualization techniques from computer scientists, researchers and artists. Some newsrooms are already beginning to retool their staffs and systems to prepare for a future in which data becomes a medium. But how do we communicate with data, how can traditional narratives be fused with sophisticated, interactive information displays? [Watch the full version with annotations and links on Stanford.eu]

The New York Times’ Cascade: Data Visualization for Tweets [VIDEO]

[youtube yQBOF7XeCE0]

MASHABLE – by Jolie O’Dell

The research and development department of The New York Times has recently been pondering the life cycle of the paper’s news stories in social media — specifically, on Twitter. Cascade is a project that visually represents what happens when readers tweet about articles.

Even now, however, Cascade is more than just a nifty data visualization. [Read more…]


Announcing news:rewired – noise to signal, 27 May 2011

NEWS REWIRED

Logo from the News:Rewired website

Journalism.co.uk’s next News:Rewired event will take place on 27 May at Thomson Reuters’ London offices.

What’s it about?

news:rewired – noise to signal is a one-day event for journalists and communications professionals who want to learn more about the latest tools and strategies to filter large datasets, social networks, and audience metrics into a clear signal for both the editorial and business side of the news industry. [Read more…]