How to do a good visualisation and why it’s important

Visualisations are an important tool when presenting data, and can be used to show patterns, correlations and the ‘big picture’.

Ben Fry has said that visualisations ‘answer questions in a meaningful way that makes answers accessible to others’ and Paul Bradshaw explains that ‘visualisation is the process of giving a visual form to information which is otherwise dry or impenetrable.’

Traditionally stories have been conveyed through text, and visualisations have been used to display additional or supporting information. Recently, however, improved software has allowed journalists to create sophisticated narrative visualisations that are increasingly being used as standalone stories. These can be be linear and interactive, inviting verification, new questions and alternative explanations.

Continue reading “How to do a good visualisation and why it’s important”

The Royal Wedding: An experiment in data journalism

WANNABE HACKS: by Matthew Caines

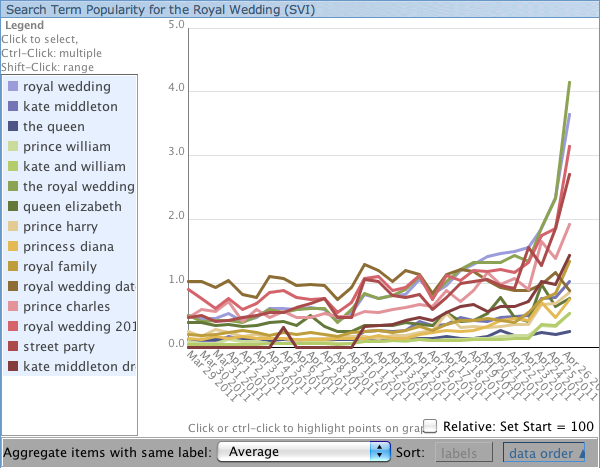
Graph by Matthew Caines using ManyEyes

UPDATE: After having a stab at data journalism today, my first ever piece has since been featured on the MANY EYES homepage. Not too bad for first-timer…

Seeing as today is all about taking the plunge and tying the knot, I’ve been thinking about joining to someone in holy matrimony myself… to data journalism! I say taking the plunge because it’s not necessarily a match made in heaven – data journalism is something I’ve often shied away from, always assuming the tech geeks + web guys are the only ones who can do it and do it well.

My cold feet were that anyone who saw my Microsoft Word multi-coloured pie-chart would surely scoff at my horrendous attempt at interactive data. But I need this marriage to work because data journalism is fast becoming a valuable skill for any aspiring journalist. [Read more…]


10 things every journalist should know about data

NEWS:REWIRED: by SARAH MARSHALL

Picture from News:Rewired website

Every journalist needs to know about data. It is not just the preserve of the investigative journalist but can – and should – be used by reporters writing for local papers, magazines, the consumer and trade press and for online publications.

Think about crime statistics, government spending, bin collections, hospital infections and missing kittens and tell me data journalism is not relevant to your title.

If you think you need to be a hacker as well as a hack then you are wrong. Although data journalism combines journalism, research, statistics and programming, you may dabble but you don’t need to know much maths or code to get started. It can be as simple as copying and pasting data from an Excel spreadsheet. [Read more…]