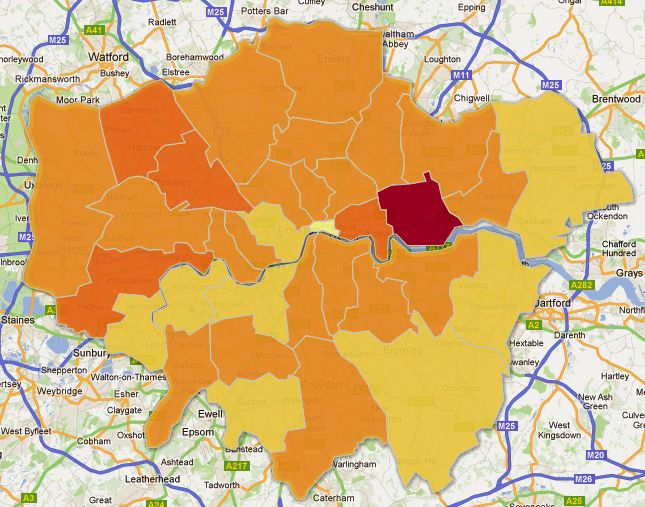
 This heat map, produced on Google Fusion Tables presents the levels of overcrowding in London, as in 2010. The data was published by the London datastore in March 2012 and presented figures for both the base figure (number of houses overcrowded) and that number as a percentage of the whole borough. The information mapped here is the percentage figures, however, the map is interactive, and clicking on each borough will give you the base figure information.
Overcrowding for the purposes of this data set is defined by the ‘bedroom standard’, explained on the London Datastore website:
‘Bedroom standard’ is used as an indicator of occupation density. A standard number of bedrooms is allocated to each household in accordance with its age/sex/marital status composition and the relationship of the members to one another. A separate bedroom is allocated to each married or cohabiting couple, any other person aged 21 or over, each pair of adolescents aged 10 – 20 of the same sex, and each pair of children under 10. Any unpaired person aged 10 – 20 is paired, if possible with a child under 10 of the same sex, or, if that is not possible, he or she is given a separate bedroom, as is any unpaired child under 10. This standard is then compared with the actual number of bedrooms (including bed-sitters) available for the sole use of the household, and differences are tabulated. Bedrooms converted to other uses are not counted as available unless they have been denoted as bedrooms by the informants; bedrooms not actually in use are counted unless uninhabitable.
Overcrowding figures include households with at least one bedroom too few.
The map clearly shows that the borough of Newham has the worst overcrowding situation with 17.9 per cent of households in the borough overcrowded; a figure of 506 households. However, the borough with the highest base rate figure was Enfield, with 670 households being overcrowded, 7.1 per cent of the borough.
In July 2011, Shelter Housing charity announced that their analysis of the English Housing Survey revealed that 391,000 children (24 per cent) in London suffered from overcrowding, which they said was an 18 per cent rise since 2008. Unfortunately the data provided by the Datastore did not break down the data into person specification categories, however, it is clear from the figures that overcrowding in London is a growing problem.
The Fusion Map was created by importing data from a spreadsheet into Google Fusion Tables and then merging this data with KML shape files for London, to get the heat map effect. Each Borough has an identification code, which my original data did not have, so I had to input this manually for each borough in my original data set before merging the two files – this provides a point of reference for the merge, so there are two identical pieces of information for each row to match up with.
I then chose the column I wanted the map to represent, in this case the percentage data. To get the map to show a range of colours related to the data, I set the map to have what are called “buckets”, this is the range of numbers represented by each colour. I then modified the colours I wanted to use with a system called colorbrewer, which allows you to customize colours showing specific colour ranges for heat maps. Finally I modified the information windows for each borough to show specifically the information I wanted, and in the style I wanted – this takes a small amount of HTML know-how.
I hope you enjoy this data map, and are inspired to create your own maps using Google Fusion in the future.
