OWNI.EU
Data journalism can make sense out of very complicated and sometimes uncommon information. But some creative minds came up with really good data visualisation regarding our daily life activities and in this instance: Sex. So here is an article from OWNI.eu, originally published on OkCupid’s blog, dealing with many aspects of our tumultuous sex life. . . Enjoy!
This was one of the first infographics ever made:

Later remembered as “the map that made a nation cry”, it depicts Napoleon’s failed invasion of Russia in 1812. The wide tan swath shows his Grande Armée, almost half a million strong, marching East to Moscow; the black trickle shows the few who straggled back. It’s an elegant fusion of geography, time, and temperature into a single statement of military disaster.
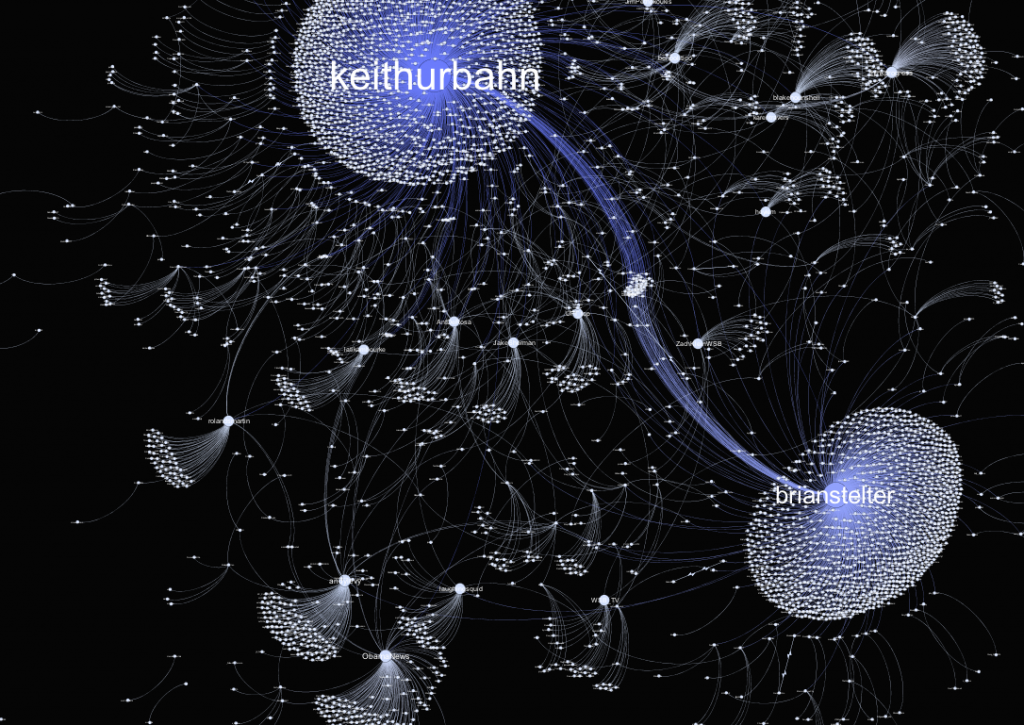
Of course, using modern tools of analysis, like circles and the color blue, we can get an even clearer picture of history:

It is our goal today to create graphics of similar concision and power, but about something more useful than war—sex.
All the data below, even the most personal stuff, has been gleaned from real user activity on OkCupid. Some of it our users have told us outright by answering match questions; some of it we’ve had to learn from observation.
Other than the unifying theme, sex, there’s no big point or thesis to this post: just comparisons, correlations, and quirky trends.
Chart #1

We found this by crossing the match questions Do you like to exercise? and Is it difficult for you to have an orgasm?, and, as you can see, women who don’t like working out report twice the orgasm problems of women who do.
Chart #2
Here, we took a single question—Is your ideal sex rough or gentle?—and scraped people’s profile text for the words that most correlated to each answer. Here are word clouds for women and men in their 20s.

The text is basically Hot Topic versus, I dunno, Burberry. But beyond the words the interesting thing is how men’s and women’s preferences change with age:

This dataset only includes single people, of course, but I was still very surprised at how many old men like it rough. Looks like I’m going to have to rethink a cherished part of my worldview.

Chart #3
The odds shown in this chart, and the others like it later in the post, are odds “in favor”—in this case, odds in favor of being into giving oral sex. The higher a group’s odds, the more into it they are.

Since so much sexual slang involves meat—”hot dog,” “sausage,” “burger,” “beef injection,” “another beef injection,” and so on—I thought this would be a fine occasion to point out that there are plenty of veggie alternatives:
Vegetarian-Friendly Sex Slang
Peeling the banana.
Tossing the salad.
Squeezing the melons.
Zeroing in on a grown man’s nuts and nutsack.
Putting Monsanto in yoursanto.
Ordering the split pea soup.
Sorry, that’s got ham.
Cornholing others.
Charts #4 & #5

Frequent tweeters have shorter real-life relationships than everyone else, probably via some bit.ly hack. Unfortunately, we have no way to tell who’s dumping who here; whether the twitterati are more annoying or just more flighty than everyone else. There is also this:

If someone tweets every day, it’s 2-to-1 that they’re #ingthemselves just as often. Like the “shorter relationships” thing, this is true across all age and gender groups.
Chart #6:
 In the Bible, in between the part where Reuben kills a he-goat so he can dip some clothes in the blood of the he-goat and where Judah tries to give Tamar a goat but decides maybe she should be burned to death instead, God kills a man named Onan because Onan intentionally spills his seed on the ground.
(1) Thou shalt not whack off. (2) Mo goats mo problems.
Life lessons! From the Iron Age!
Charts #7 & #8
This bubble chart, plotting body type, sex drive, and self-confidence, is dynamic—you can use the slider at the bottom change it. As you can see as you move the control from left to right, a woman’s sexuality peaks in her twenties, holds more or less steady for twenty years, and then falls to the floor. And while sex drive waxes and wanes, self-confidence steadily grows.


Remember, the women themselves select their body-descriptions; the bubbles show the size of each group. Though many of the words are just a shade of meaning apart, there are dramatic differences in the traits of the people who choose them. Go through the animation and compare full-figured to curvy orskinny to thin.
It’s particularly interesting to isolate skinny—a deprecating way to say something generally considered positive (being thin)—and curvy—an empowering way to say something generally considered negative (being heavy). Here are those bubbles’ complete paths across the graph:
 Curvy women pass skinny ones in self-confidence at age 29 and never look back. They also consistently have the highest sex drive among the groups. Curvy, as a word, has the strongest sensual overtones of all our self-descriptions. So we’re getting a little insight into the real-world implications of a label.
This is the “complete path” plot for men:
 Things to notice: (1) almost no men choose curvy or full-figured as self-descriptions, so those words aren’t plotted here; (2) men of all body types have roughly the same peak sex drive; (3) and the thing that matters most for guys is simply to not be overweight. The other four body types are clustered relatively together at most ages.
Chart #9
For this chart, we took our own data and mixed it with a little outside stuff: college tuitions from U.S. News & World Report.

Generally speaking, the more your parents are paying for your education, the more horny you are. If only Freud were still around to help us understand; instead we have psychology majors, those Adidas shower sandals, and darkness.
You can think of the dotted best-fit line as dividing the good sex-ed values (above the line) from the bad ones (below). The line also gives us a handy sliding scale: given a 36-week school year and the average partner, every $2,000 spent on your college tuition is an extra time you could be having sex that year.
Chart #10
The correlation between sex and money is robust for colleges, but it gets even stronger when extended to entire nations.
 We were amazed at this result—money seems to be a more powerful influence on sex drive than culture or even religion.
You have, for example, Portugal, Oman, Slovenia, and Taiwan within a few pixels of each other on the right side of the graph, and Syria, Sri Lanka, and Guatemala almost stacked on the left, and all of them sit along the trend line.
—-
This post was originally published on OkCupid’s blog
Photo Credits: OkCupid and Flickr CC HikingArtist.com



 Curvy women pass skinny ones in self-confidence at age 29 and never look back. They also consistently have the highest sex drive among the groups. Curvy, as a word, has the strongest sensual overtones of all our self-descriptions. So we’re getting a little insight into the real-world implications of a label.


